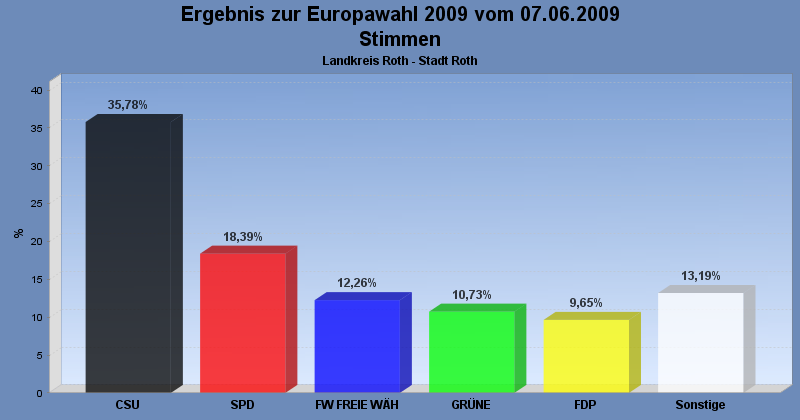
Ergebnis zur Europawahl 2009 am 07.06.2009
Landkreis Roth - Stadt Roth
Es wurden alle Wahlbezirke ausgewertet.
Wahlbeteiligung, Stimmzettel, Stimmen
| Wahlbeteiligung: | 38,65% |
|---|
| Stimmberechtigte: | 19.010 |
|---|
| Wähler: | 7.348 |
|---|
| |
| Ungültige Stimmen: | 62 |
|---|
| Gültige Stimmen: | 7.286 |
|---|
 Seitenanfang
Stimmen nach Wahlvorschlag
| WV-Nr |
Partei |
Stimmen |
Prozent |
| 1 |
CSU |
2.607 |
35,78% |
| 2 |
SPD |
1.340 |
18,39% |
| 27 |
FW FREIE WÄHLER |
893 |
12,26% |
| 3 |
GRÜNE |
782 |
10,73% |
| 4 |
FDP |
703 |
9,65% |
| 9 |
DIE LINKE |
221 |
3,03% |
| 6 |
REP |
100 |
1,37% |
| 5 |
ödp |
93 |
1,28% |
| 8 |
Die Tierschutzpartei |
60 |
0,82% |
| 30 |
RRP |
60 |
0,82% |
| 31 |
RENTNER |
59 |
0,81% |
| 7 |
BP |
50 |
0,69% |
| 10 |
FAMILIE |
44 |
0,60% |
| 29 |
PIRATEN |
40 |
0,55% |
| 12 |
DIE FRAUEN |
25 |
0,34% |
| 21 |
DVU |
24 |
0,33% |
| 11 |
Volksabstimmung |
23 |
0,32% |
| 23 |
DIE VIOLETTEN |
22 |
0,30% |
| 13 |
PBC |
21 |
0,29% |
| 20 |
AUF |
21 |
0,29% |
| 26 |
FÜR VOLKSENTSCHEIDE |
21 |
0,29% |
| 19 |
50Plus |
18 |
0,25% |
| 22 |
DIE GRAUEN |
18 |
0,25% |
| 15 |
AUFBRUCH |
9 |
0,12% |
| 14 |
CM |
8 |
0,11% |
| 25 |
FBI |
8 |
0,11% |
| 28 |
Newropeans |
7 |
0,10% |
| 17 |
BüSo |
3 |
0,04% |
| 18 |
PSG |
3 |
0,04% |
| 16 |
DKP |
2 |
0,03% |
| 24 |
EDE |
1 |
0,01% |
- Stand: 10.06.2009 15:15:35
Seitenanfang
 Diagramm