OK.Wahl
Internetpräsentation
Version 2.2.9
Ergebnis zur Kreistagswahl 2014 am 16.03.2014
Landkreis Roth - Stadt Roth - Stimmbezirk Evang. Gemeindehaus Rothaurach (0025)
Stimmbezirk ausgewertet.
 Diagramm
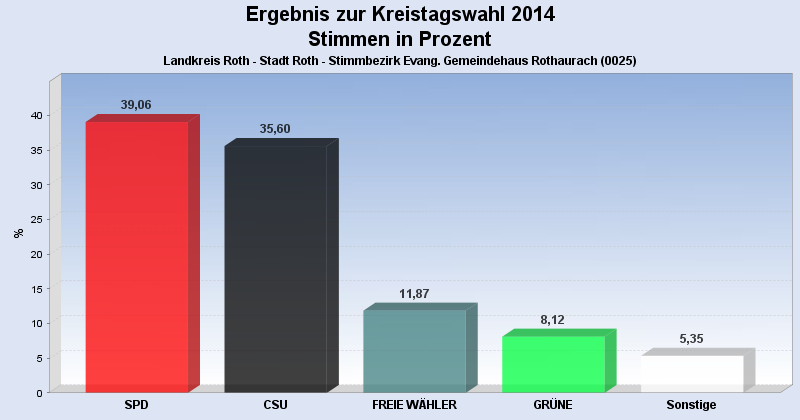
 Seitenanfang
Wahlbeteiligung, Stimmzettel, Stimmen
| Stimmberechtigte: | 718 |
|---|---|
| Wähler: | 134 |
| Ungültige Stimmen: | 7 |
| Gültige Stimmen: | 5.922 |
Stimmen nach Wahlvorschlag
| Partei | Stimmen | Prozent | WV unveränd. gekennzeichnet |
innerh. eines WV's veränd. |
|
|---|---|---|---|---|---|
| 2 | SPD | 2.313 | 39,06% | 15 | 13 |
| 1 | CSU | 2.108 | 35,60% | 12 | 18 |
| 3 | FREIE WÄHLER | 703 | 11,87% | 5 | 2 |
| 4 | GRÜNE | 481 | 8,12% | 1 | 1 |
| 6 | CWG Landkreis Roth | 169 | 2,85% | 0 | 0 |
| 5 | FDP | 148 | 2,50% | 0 | 0 |
- Stand: 01.04.2014 10:24:24