OK.Wahl
Internetpräsentation
Version 2.2.9
Ergebnis zur Kreistagswahl 2014 am 16.03.2014
Landkreis Roth - Gemeinde Rednitzhembach - Stimmbezirk Igelsdorf-West (0009)
Stimmbezirk ausgewertet.
 Diagramm
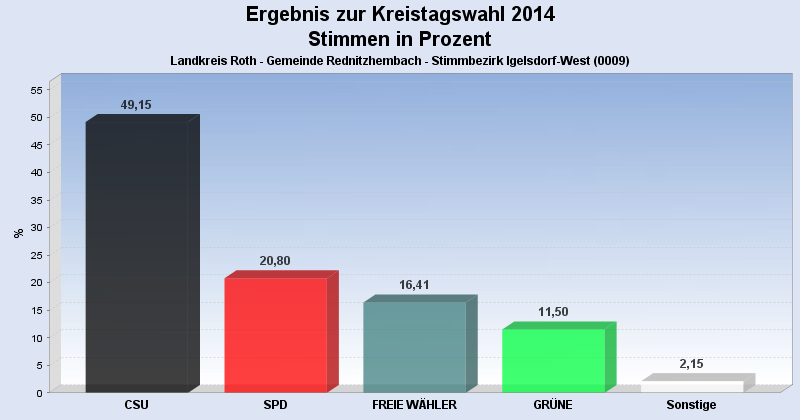
 Seitenanfang
Wahlbeteiligung, Stimmzettel, Stimmen
| Stimmberechtigte: | 447 |
|---|---|
| Wähler: | 146 |
| Ungültige Stimmen: | 4 |
| Gültige Stimmen: | 7.972 |
Stimmen nach Wahlvorschlag
| Partei | Stimmen | Prozent | WV unveränd. gekennzeichnet |
innerh. eines WV's veränd. |
|
|---|---|---|---|---|---|
| 1 | CSU | 3.918 | 49,15% | 47 | 17 |
| 2 | SPD | 1.658 | 20,80% | 18 | 5 |
| 3 | FREIE WÄHLER | 1.308 | 16,41% | 16 | 2 |
| 4 | GRÜNE | 917 | 11,50% | 10 | 3 |
| 5 | FDP | 116 | 1,46% | 1 | 0 |
| 6 | CWG Landkreis Roth | 55 | 0,69% | 0 | 1 |
- Stand: 01.04.2014 10:24:12