OK.Wahl
Internetpräsentation
Version 2.2.9
Ergebnis zur Kreistagswahl 2014 am 16.03.2014
Landkreis Roth - Gemeinde Georgensgmünd - Stimmbezirk Georgensgmünd (0008)
Stimmbezirk ausgewertet.
 Diagramm
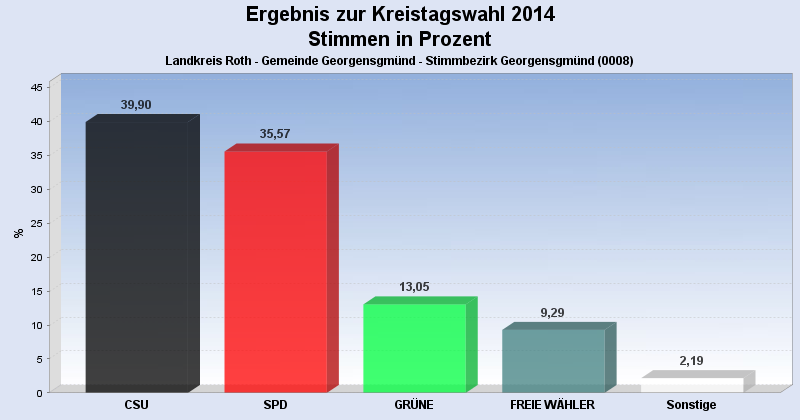
 Seitenanfang
Wahlbeteiligung, Stimmzettel, Stimmen
| Stimmberechtigte: | 431 |
|---|---|
| Wähler: | 119 |
| Ungültige Stimmen: | 6 |
| Gültige Stimmen: | 5.854 |
Stimmen nach Wahlvorschlag
| Partei | Stimmen | Prozent | WV unveränd. gekennzeichnet |
innerh. eines WV's veränd. |
|
|---|---|---|---|---|---|
| 1 | CSU | 2.336 | 39,90% | 12 | 8 |
| 2 | SPD | 2.082 | 35,57% | 15 | 7 |
| 4 | GRÜNE | 764 | 13,05% | 7 | 0 |
| 3 | FREIE WÄHLER | 544 | 9,29% | 4 | 0 |
| 5 | FDP | 104 | 1,78% | 0 | 0 |
| 6 | CWG Landkreis Roth | 24 | 0,41% | 0 | 0 |
- Stand: 01.04.2014 10:23:45