OK.Wahl
Internetpräsentation
Version 2.2.9
Ergebnis zur Kreistagswahl 2014 am 16.03.2014
Landkreis Roth - Stadt Abenberg - Stimmbezirk Bechhofen, Kleinabenberg, Obersteinbach (0007)
Stimmbezirk ausgewertet.
 Diagramm
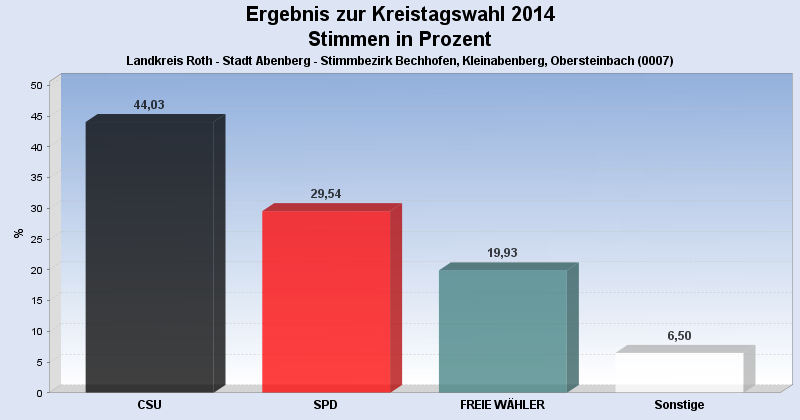
 Seitenanfang
Wahlbeteiligung, Stimmzettel, Stimmen
| Stimmberechtigte: | 427 |
|---|---|
| Wähler: | 80 |
| Ungültige Stimmen: | 4 |
| Gültige Stimmen: | 3.754 |
Stimmen nach Wahlvorschlag
| Partei | Stimmen | Prozent | WV unveränd. gekennzeichnet |
innerh. eines WV's veränd. |
|
|---|---|---|---|---|---|
| 1 | CSU | 1.653 | 44,03% | 6 | 4 |
| 2 | SPD | 1.109 | 29,54% | 8 | 2 |
| 3 | FREIE WÄHLER | 748 | 19,93% | 2 | 2 |
| 4 | GRÜNE | 108 | 2,88% | 0 | 0 |
| 5 | FDP | 104 | 2,77% | 0 | 0 |
| 6 | CWG Landkreis Roth | 32 | 0,85% | 0 | 0 |
- Stand: 01.04.2014 10:23:32